M-LINK
2D CAD file (PDF)
- 9143C
- English
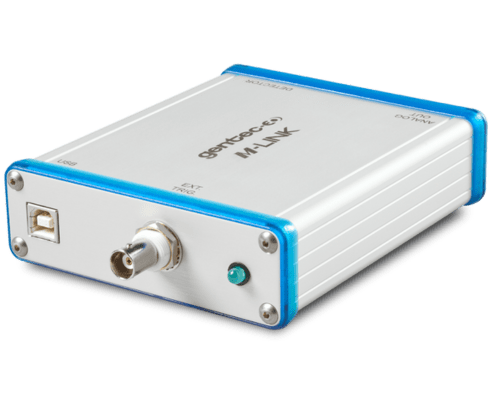
PC interface for power & energy measurement. Single-channel, USB output.
Reads all heads:
Thanks to a unique digital method for suppressing the noise on the lower ranges
Synchronize your M-LINK to your pulsed laser or digital chopper
Connect the M-LINK module directly to your PC
Features include:

USB cable for : P-LINK, S-LINK-2, M-LINK, Mach series, T-Rad and QUAD-4Track.

Calibration certificate

Software for M-LINK series.

LabVIEW VI examples for 8.0+ (Basic example)

LabVIEW VI examples for 9.0+ (Extended VI)

Use this file to install USB drivers for these products: MAESTRO, INTEGRA, U-LINK, P-LINK, M-LINK, S-LINK, BLU, PRONTO, HP

This PC-Based monitor is compatible with all types of detectors - including thermopiles, pyroelectrics and photo detectors - for both power and energy measurements. The device is available as a single channel unit that directly interfaces with a computer using a USB 2.0 connection. The LabView software is included and comes with all the necessary features. The M-LINK also presents a unique digital technique of suppressing the noise, thereby extending the measurement range all the way down to the fJ level.

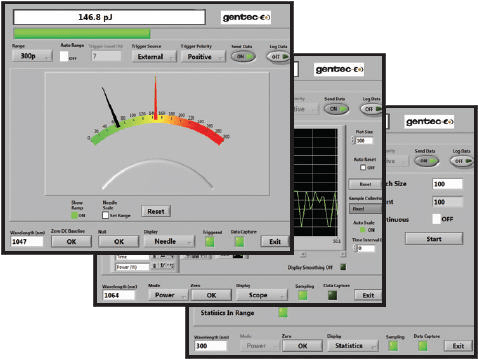
What makes the M-LINK so universal is its compatibility with every detector type and model we make, and our smart software that recognizes the type of detector attached, and configures itself accordingly. Some of the basic software features include:

If you need to measure low power levels, from pW to mW, then we recommend one of our PH or PH-B detectors. In the software screen shown on the left, we have taken a data set working in the “stats” display mode. We have set the batch size to 100 data points in the manual reset mode. You can see the live power (138 nW) and full complement of statistics: mean, max, min, RMS and PTP stability. In the bottom left hand corner you will note that a wavelength of 300 nm is displayed. This is where you will enter the wavelength of your laser and engage the wavelength correction factor.

You can select any of our thermal detectors to measure your laser power from a few μW up to 30 kW. We used one of our most sensitive thermopile detectors, model XLP12-3S-H2, to generate the software screen shown on the left. We have selected the “scope” mode, where you can view the live power reading (0.404 W), a bar graph and a strip chart while monitoring the power. This high level screen also provides access to range, trigger, auto scale, and many other monitor functions.

Need to measure the radiant flux (watts) or irradiance (W/cm2) of a broadband source like the sun, a lamp, a temperature controlled black body and/or a mid or far-IR laser? Our broadband pyroelectric detectors of the UM-B Series would be a great choice. To make the measurement that is displayed on the left, we set up our UM9B-BL detector with M-LINK, an SDC-500 Chopper running 10 Hz and our 725 °C black body source. The M-LINK recognizes the UM9B-BL detector, sets the wavelength to 633 nm where it is calibrated and prepares it to measure the voltage square wave it generates. We have engaged the area correction as the 9 mm detector is over filled with radiation. We are therefore measuring irradiance in W/cm2.

You can select one of our many large area pyroelectric detectors of the QE Series for energy measurements ranging from 50 nJ to 250 J and from DUV to Far IR. To demonstrate this capability, we have selected our QE8SP-B-BL and the M-LINK. We are looking at the “histogram” screen, where you can continue to view the live measurement and a histogram that shows the energy distribution of your data set, along with a best-fit Gaussian curve. Note that you still have access to the instrument controls, like range, trigger, wavelength, etc.

For measurements in the fJ to μJ range, and from UV to near-IR we suggest our PE3B-Si detector. It represents the state-of-the-art in low-end energy detector technology. Take advantage of our proprietary pulse averaging, noise reduction techniques available with M-LINK. In the example shown at the right, we have captured a data set while running in the “averaging” mode. The bars represent minimum (white) and maximum (blue) energy values. The strip chart is based on the average energy value. You get to select the number of “bins” represented here. “Pulse averaging” is available in the statistics screen.

If you are trying to measure a relatively high energy (joules) single pulse (up to 300 msec long), you will select one of our thermopile power detectors (like the UP50-W9), have it calibrated in single shot mode and use the M-LINK to make the measurement. In the screen at the right, we have captured a long pulse that had a duration of a few hundred milliseconds and are displaying the energy in the “scope” screen. Using a variety of our thermopile detectors, you can measure from 12 μJ to 500 J in a single pulse.

Use our serial commands to communicate directly with the meter without using Gentec-EO's software. You can do so using a terminal emulator software, like PuTTY, or you can just integrate them directly into your own software. All essential functions of the meter are covered by a command. Refer to the user manual of the meter for the list of all commands available.
*Does not include shipping fees, import fees or local representation. Request quote for full details and local sales contact.
You might need these specific products to be able to use the placeholder only.
No compatible product