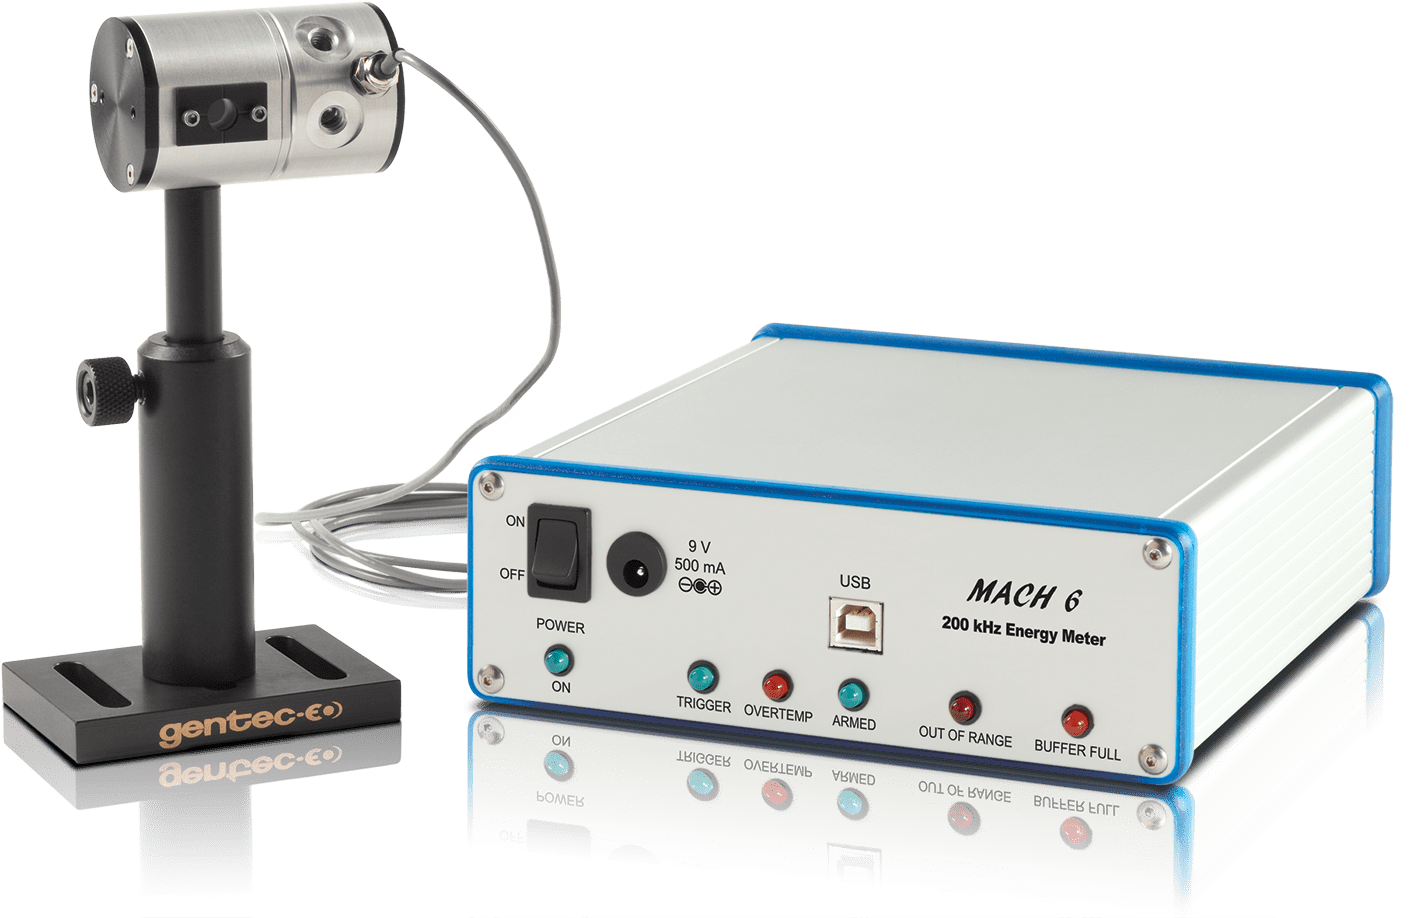
MACH 6
2D CAD file (PDF)
- Английский
200 kHz module for M6 heads.
Measure every pulse, with no sampling, at high rep rates, up to 200 kHz
Store 40 seconds of data at 100 kHz
Know how many pulses were missed or that didn’t make the energy threshold with this unique pulse feature
Silicon, InGaAs and pyroelectric heads for a broad wavelength and energy range
Use our fast M6 detectors with the APM and an oscilloscope for fast analog energy measurements
Ensures high data rate transfer and fast operation


Software for Mach 6 series.

This is a set of LabVIEW VI’s that allow for the use of all the basic MACH 6 functions.

LabVIEW VI examples for basic MACH 6 operation.

Measure every pulse at up to 200 kHz with MACH 6. Measure with 12-bit digital accuracy and capture up to 4 million pulses in real time. Our MACH 6 joulemeter is the only instrument in the world that performs at this speed, and with this precision. It is designed to support our full complement of fast energy probes that include silicon, InGaAs and pyroelectric detectors. Measure from pJ to mJ and from 0.35 to 2.5 µm. Using the M6-SI detector and the M5-UC-QED accessory, you can make relative measurements at 266 nm.

Our powerful LabView application software includes many unique control and diagnostic features. The instrument control screen, shown on the left, is used to set up the operation of the MACH 6, including range, trigger, wavelength, and more. In addition, it is used to set a pulse batch size and to arm the instrument, which starts the data collection. It also gives you access to features like "autoset", "call live mode", "run life test", "save instrument setup" and the like. These features can be accessed by clicking directly on the feature or pushing the associated function key.

The live mode can be accessed from the instrument control screen, or by simply pressing the "F4" function key on your PC. This mode of operation is intended to act like your typical slower Digital joulemeter, as it samples the laser pulses at a 10 Hz rate. It provides you with an energy strip chart, live energy reading, statistics and repetition rate. It is a very useful mode when setting up the Mach 6 with your laser. You can select "auto set", where the instrument runs through the ranges and trigger levels until it finds the correct range, or set them manually. When setup is complete, you will exit this screen and return to the "control" screen where you will select a batch size, arm the instrument and start taking pulse energy data.

The strip chart display provides a quick graphical look at the pulse data batch just collected. The data can be displayed in full scale or in auto scale mode. You can also zoom-in on a portion of the data, like shown in the screen on the left. An ND0.3 filter has been dropped through the beam and you can see the effects on the pulse data collected. You can fit trend and min/max lines to the data. Just below the chart, you will find a complete set of statistics for the batch. At the top of this screen you will see tabs that will take you to the histogram, statistics, and FFT (Fast Fourier Transform) displays.

Interested in viewing the statistical distribution of the pulse energy data set? The Histogram screen does this for you and fits a "best Gaussian curve" to the data. It displays complete statistical calculations along the bottom of the graph, along with pulse frequency. Just below the statistics, you will find instrument controls, like range and trigger. You are also given the ability to adjust trigger delay and hold off as needed.

The statistics display offers a very complete set of useful energy readings and calculated statistics. These include: minimum, maximum, average (mean), standard deviation, spread and variation. Some other very handy features include: windows displaying, Average frequency, pulse jitter, pulses below trigger and pulses below threshold (a level set by you). In the screen on the left, you can see that there were 12 pulses below an energy threshold of 3 µW, and 147 missing pulses (or pulses below trigger).

Would you like to run a life test on your high repetition rate pulsed laser? How about a periodic test vs an environmental change like temperature? We have included a great feature to accomplish this. In the life test screen, we give you the ability to select the statistics you want, a start time and date, a stop time and date, the number of pulses and a test interval. You simply identify a file, a place to put the data, and then click on start and walk away! When you come back, you have a data set that tracked the performance of your laser over time, temperature, shock, vibration or anything you chose.
You might need these specific products to be able to use the placeholder only.
No compatible product